RESULTS

SOLID BUSINESS MODEL BASED ON PROFITABILITY, EFFICIENCY AND INNOVATION, WHICH has enabled US TO OBTAIN RECURRING PROFIT

First nine months attributable profit of EUR 3,732 million, 35% lower year-on-year, after recording net charges that are outside the ordinary course performance of our business amounting to EUR 2,448 million in 2019 (mainly related to the review of goodwill ascribed to Santander UK an restructuring costs in Spain) and EUR 300 million in 2018.

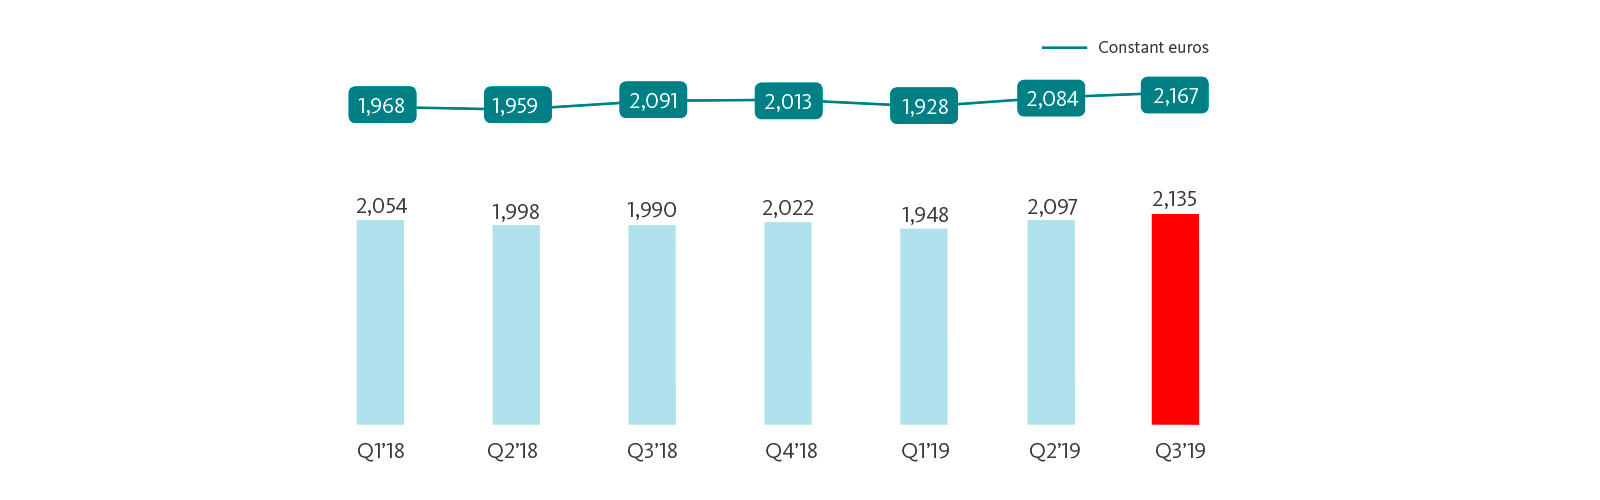
Excluding these results, the underlying attributable profit was EUR 6,180 million, 2% more than in the same period of 2018 (+3% in constant euros), showing consistent profit quarter after quarter.

In a context of lower growth and interest rates, the underlying P&L trends remained solid:

Customer revenue continued to grow.

Costs continued to reflect synergies in some countries.

Provisions increased in line with volumes.

9M'19 underlying ATTRIBUTABLE PROFIT1

Well balanced Group profit between Europe (46%) and the Americas (54%) with overall profit growth by markets and global businesses

1. Excluding Corporate Centre (EUR -1,637 mn) and Santander Global Platform.
Excluding net capital gains and provisions.

2. Uruguay and Andean Region underlying profit (EUR 159 mn).

underlying ATTRIBUTABLE PROFIT TO THE GROUP*

eur million

*Excluding net capital gains and provisions.

9M'19 underlying ATTRIBUTABLE* PROFIT IN CORE MARKETS

EUR MN AND % CHANGE VS. 9M'18 IN CONSTANT EUROS

*Excluding net capital gains and provisions.

The information shown above in relation to the different units has been prepared in accordance with homogeneous management criteria for the whole Group and may therefore differ from the information published for each company on an individual basis.

Main business areas performance

CONSTANT EUROS

In Q2, the operating segments were changed to reflect the current organisational and management structure:

  • Creation of the new geographic segment Europe that includes the existing units under the previous Continental Europe segment (Spain, Portugal, Poland and Santander Consumer Finance) plus the UK.
  • Creation of the new geographic segment North America that comprises the existing units under the previous US segment plus Mexico.
  • Creation of the new geographic segment South America that comprises the existing units under the previous Latin America segment except for Mexico.
  • Creation of a new reporting unit segment, Santander Global Platform, which includes our global digital services under a single unit.

North America

In the first nine months of the year, underlying attributable profit was EUR 1,278 million, up 20% year-on-year. Good performance in total income, both in net interest income and net fee income, which grew more than costs, resulting in an improved cost-to-income ratio.

Loan-loss provisions were up, on the back of higher volumes, and the cost of credit remained virtually unchanged.

Europe

Underlying attributable profit for the period amounted to EUR 3,640 million, down 4% compared to the first nine months of 2018, due to lower gains on financial transactions (markets) and net fee income (mainly Corporate & Investment Banking) and higher provisions.

Conversely, net interest income increased and costs fell, reflecting the first savings from our optimisation processes.

Santander Global Platform (SGP)

Continued to progress in its digital transformation objectives, launching and developing various initiatives according to the envisaged schedule.

Our goal is to extend the benefits of the talent and scale of the Group to the payment and digital businesses with higher growth, building platforms only once for all of our banks which allow us to offer the best digital services aimed at retail customers, merchants, SMEs and corporates.

South America

Underlying attributable profit in the first nine months of the year amounted to EUR 2,977 million, up 18% year-on-year due boosted by revenue with sound performance in net interest income rose and net fee income. In addition, the cost of credit improved.

On the other hand, Costs reflect commercial transformation plans, greater digitalisation of the retail network and reviews of collective wage agreements.

North America
In the first nine months of the year, underlying attributable profit was EUR 1,278 million, up 20% year-on-year. Good performance in total income, both in net interest income and net fee income, which grew more than costs, resulting in an improved cost-to-income ratio.

Loan-loss provisions were up, on the back of higher volumes, and the cost of credit remained virtually unchanged.

Europe
Underlying attributable profit for the period amounted to EUR 3,640 million, down 4% compared to the first nine months of 2018, due to lower gains on financial transactions (markets) and net fee income (mainly Corporate & Investment Banking) and higher provisions.

Conversely, net interest income increased and costs fell, reflecting the first savings from our optimisation processes.

Santander Global Platform (SGP)
Continued to progress in its digital transformation objectives, launching and developing various initiatives according to the envisaged schedule.

Our goal is to extend the benefits of the talent and scale of the Group to the payment and digital businesses with higher growth, building platforms only once for all of our banks which allow us to offer the best digital services aimed at retail customers, merchants, SMEs and corporates.

South America
Underlying attributable profit in the first nine months of the year amounted to EUR 2,977 million, up 18% year-on-year due boosted by revenue with sound performance in net interest income rose and net fee income. In addition, the cost of credit improved.

On the other hand, Costs reflect commercial transformation plans, greater digitalisation of the retail network and reviews of collective wage agreements.

Income statement

MILLION EUROS
% change vs. 9M'18
9M'19 EUR Constant
EUR
Net interest income 26,442 4.6 4.6
Gross income 36,902 2.8 3.0
Net operating income 19,593 2.9 3.0
Underlying profit before tax* 11,423 1.7 2.1
Underlying attributable profit to the Group* 6,180 2.3 2.7
Attributable profit to the Group 3,732 (35.0) (34.7)
*Excluding net capital gains and provisions.

FOR MORE INFORMATION FINANCIAL REPORT JULY - SEPTEMBER 2019