Welcome to the Quarterly Shareholder Report where you can check the most significant information about Santander's share and the Group in the fourth quarter of 2023.
Browse from the home page to access each of the sections or move the cursor downwards to view the complete report.
For Banco Santander, it is important to adapt to your tastes and preferences. To this end, we use own and third-party cookies that enable us to measure the volume and interaction of users on the website and help us improve it, allowing us to analyse your habits and create browsing profiles, in any case respecting your privacy. You can configure cookies or accept all of them. This banner will remain active until you run one of the two options. For further information, please consult our
Cookie Policy.
“2023 has been a pivotal year for Santander, in which we delivered record results and met all our targets in the right way. We added five million customers, growing revenues and profits at double digits, and increased TNAV plus cash dividend per share up 15%. As a result, we will return €5.5 billion1 to shareholders from 2023 earnings.
I am proud of our team, who delivered these excellent results while continuing to progress on the strategic transformation of our business. We are deploying our own cutting-edge technology globally to fully leverage our global and in-market scale, and taken the final steps towards creating five global businesses.
We are focused on delivering in the near-term while driving sustainable earnings growth for the future, and I am confident that 2024 will be even better for Santander, with strong momentum across our global businesses, despite heightened geopolitical risks and a slowing global economy.
Our progress in executing our strategy, combined with the strength and diversification in our model, will allow us to continue to grow whilst further improving profitability, targeting a RoTE of 16% for 2024.”
Ana Botín, Banco Santander Executive Chair
1. The bank’s shareholder remuneration policy is approximately 50% payout of the group net attributable profit (excluding the impacts that do not affect cash or capital ratios directly), split in approximately equal parts in cash dividends and share buybacks. Implementation of this policy is subject to future corporate and regulatory decisions and approvals.
01| VIDEO EXECUTIVE CHAIR
Find out the year's highlights
Attributable profit 11,076 million(+15%)
Profitability (RoTE) 15.1%
Customers 165 million
TNAVps + DPS
+15%
Double-digit growth average through-the-cycle
TNAVps + DPS includes the EUR 5.95 cent cash dividend paid in May 2023 and the EUR 8.10 cent cash dividend paid in November 2023.
02| SHARE ACTIVITY
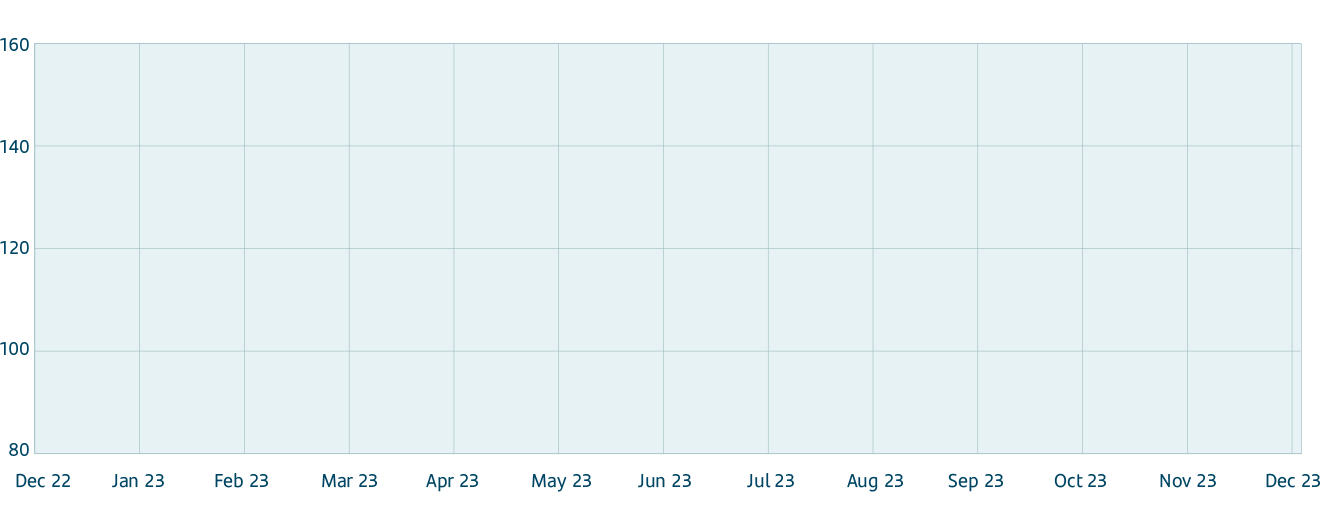
Santander's share price ended 2023 at EUR 3.780 per share
START EUR 2.803 30/12/2022
MAXIMUM EUR 3.970 06/12/2023
MINIMUM EUR 2.812 03/01/2023
END EUR 3.780 29/12/2023
Key factors shaping share price performance
Global economic activity experienced a gradual slowdown in the year, labour markets remained solid, but with different trends across countries. In the economic and geopolitical sphere, focus remained on the Middle East, although uncertainty reduced gradually, mitigating the risk of another energy price shock.
Inflation rates globally continued to decline gradually, mainly due to lower food and energy contributions.
In Q4 2023, the fall in inflation and the economic slowdown generated expectations of rate cuts: markets went from being "high for longer" to re-evaluating the likely downward path. The Federal Reserve, the Bank of England and the European Central Bank have held interest rates since September. Central banks in Latin America, such as Chile, Brazil and Uruguay, have already started to lower interest rates, joined by the Central Bank of Poland, which has lowered its reference rate one percentage point since September.
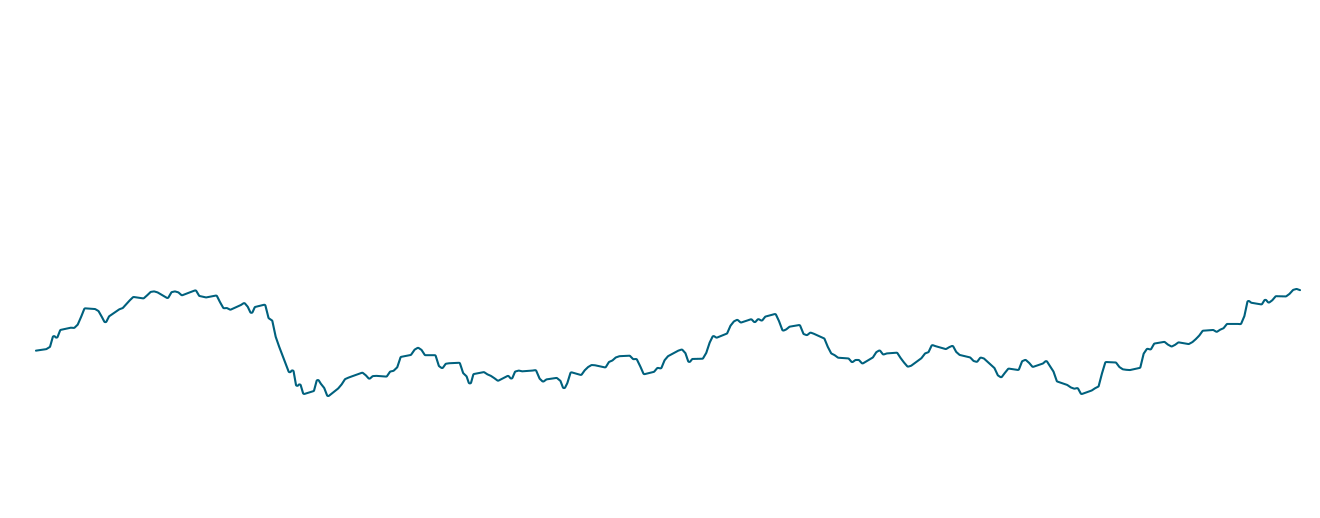
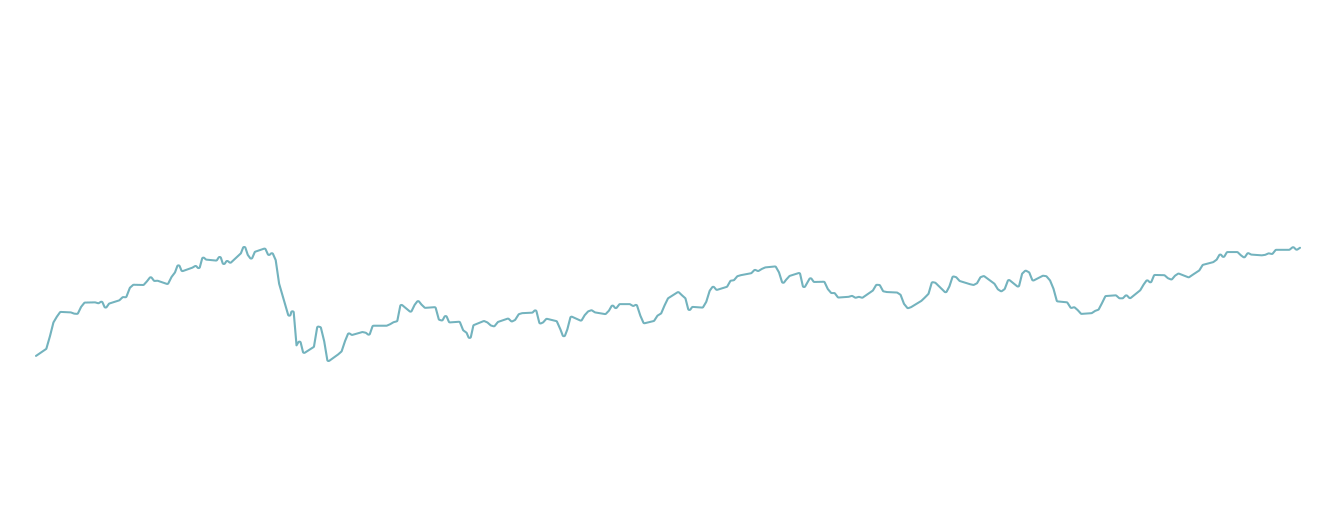
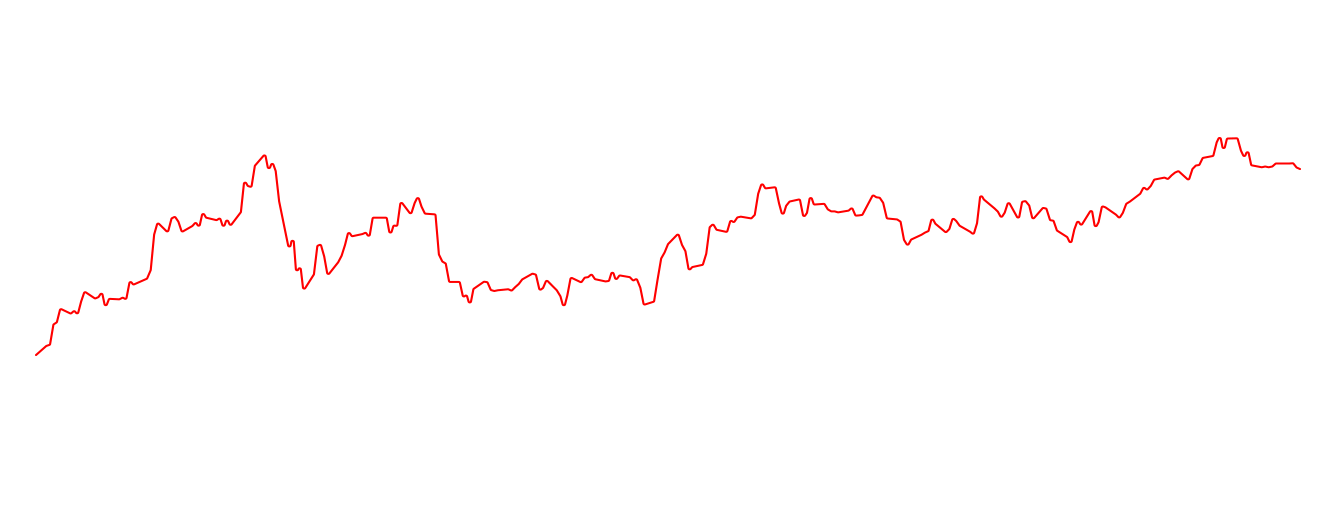
In this environment, the Santander's share price ended the year with a positive return of 34.9%, outperforming the market. In the banking sector, EuroStoxx Banks was up 23.5%, DJ Stoxx Banks increased 20.3% and MSCI World Banks rose 10.4%. The other main indices closed up, Ibex 35 +22.8% and DJ Stoxx 50 +12.1%.
The Santander share ended 2023 up by
34.9%
BANCO SANTANDER: +34.9%
EUROSTOXX BANKS: +23.5%
DJ STOXX BANKS: +20.3%
MSCI WORLD BANKS: +10.4%
IBEX 35: +22.8%
DJ STOXX 50: +12.1%
BANCO SANTANDER: +34.9%
EUROSTOXX BANKS: +23.5%
DJ STOXX BANKS: +20.3%
MSCI WORLD BANKS: +10.4%
IBEX 35: +22.8%
DJ STOXX 50: +12.1%
BANCO SANTANDER: +34.9%
EUROSTOXX BANKS: +23.5%
DJ STOXX BANKS: +20.3%
MSCI WORLD BANKS: +10.4%
IBEX 35: +22.8%
DJ STOXX 50: +12.1%
BANCO SANTANDER: +34.9%
EUROSTOXX BANKS: +23.5%
DJ STOXX BANKS: +20.3%
MSCI WORLD BANKS: +10.4%
IBEX 35: +22.8%
DJ STOXX 50: +12.1%
BANCO SANTANDER: +34.9%
EUROSTOXX BANKS: +23.5%
DJ STOXX BANKS: +20.3%
MSCI WORLD BANKS: +10.4%
IBEX 35: +22.8%
DJ STOXX 50: +12.1%
BANCO SANTANDER: +34.9%
EUROSTOXX BANKS: +23.5%
DJ STOXX BANKS: +20.3%
MSCI WORLD BANKS: +10.4%
IBEX 35: +22.8%
DJ STOXX 50: +12.1%
Share price comparison
Select comparables
30 December 2022 = 100.
of analysts recommend buying or holding SAN shares
66.7% Buy
30.3% Hold
3.0% Sell
EUR 4.85
average target price of analysts for SAN shares
Source Bloomberg at 29/12/2023.
Market capitalization
EUR 61,168
million
2nd
in the eurozone among financial institutions
Weighting of the Santander share on the main indices:
DJ Stoxx Banks
6.94%
DJ Euro Stoxx Banks
11.76%
Ibex 35
11.75%
Source Bloomberg and Madrid Stock Exchange at 29/12/2023.
Negotiation
11,132 mn
Santander shares were traded in the period for an effective value of EUR 38,144 million.
68%
liquidity ratio.
43.7 mn
shares were traded daily with an effective value of EUR 150 million.
Source Bloomberg and Madrid Stock Exchange at 29/12/2023.
03| SHAREHOLDER BASE
Banco Santander has 3,662,377 shareholders
Share capital distribution by type of shareholder:
In application of the shareholder remuneration policy for 2023, in November, the bank paid a cash dividend of EUR 8.10 cents per share (pre-tax) charged to 2023 results.
In addition, on 26 September 2023, the board approved a share buyback programme against 2023 results for EUR 1,310 million that was executed between 28 September 2023 and 25 January 2024. Under the authorization from the AGM of 31 March 2023, on 30 January 2024 the board resolved to reduce the share capital in the amount of EUR 179,283,744 by cancelling the 358,567,487 shares repurchased in the above mentioned buyback programme, representing 2.22% of the share capital. The share capital will become EUR 7,912,789,286 represented by 15,825,578,572 shares.
The bank's board is expected to propose to the AGM and disclose on the date of the meeting the approval of a final cash dividend, in line with the current shareholder remuneration policy1 of approximately 50% of the Group's underlying profit (excluding non-cash impacts and direct effect on capital ratios), divided approximately equally between cash dividends and share repurchases. As a result, the cash dividend per share paid against 2023 results is expected to be approximately 50% higher than the one paid against 2022.
1. Execution of the shareholder remuneration policy is subject to future corporate and regulatory decisions and approvals.
05| BUSINESS MODEL
Our business model is based on three pillars
Digital bank with branches
Transform our business and operating model through our global technology initiatives to build a digital bank with branches that provides access to financial services for our customers through several channels.
Top 3 NPS1 in 7 markets
165 mn total customers
100 mn active customers
1. NPS – internal benchmark of individual customers' satisfaction audited by Stiga/Deloitte in H2'23.
Local and global scale
In-market scale in each of our core markets in volumes combined with our global scale support greater profitability and provide a competitive advantage over local peers.
Top 3 in lending2 in 9 of our markets
2. Market share in lending as of September 2023 including only privately-owned banks. Digital Consumer Bank (DCB) refers to auto in Europe.
Geographic and business diversification. Solid and diversified balance sheet
Our well-balanced diversification between developing and mature markets, as well as between business and customer segments, delivers recurrent pre-provision profit with low volatility.
Contribution to Group's profit 3
Europe
45%
North America
20%
South America
25%
Digital Consumer Bank
10%
3. FY'23 attributable profit by region as a percentage of total operating areas excluding the Corporate Centre.
06| RESULTS
Attributable profit 2023
EUR 11,076 mn
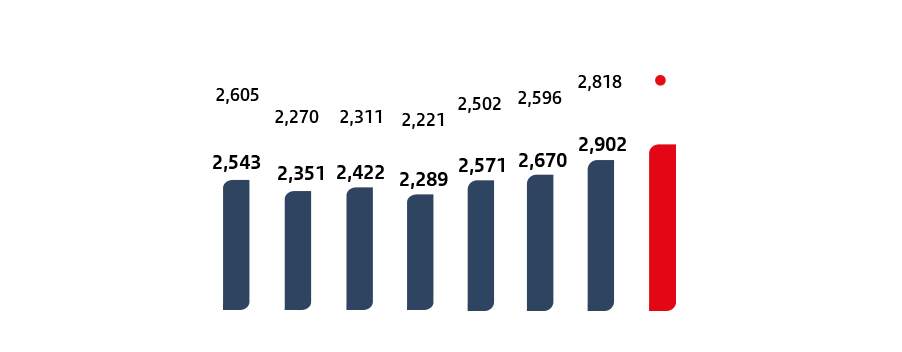
In Q4 2023, attributable profit amounted to EUR 2,933 million, 1% more than in the previous quarter (+12% in constant euros) and 28% more than in Q4 2022 (+42% in constant euros).
In 2023, attributable profit was EUR 11,076 million, 15% higher than in the same period in 2022 (+18% in constant euros) and 18% and 20% higher, respectively, if we exclude the temporary levy on revenue obtained in Spain and DCB in Q1 2023.
TOTAL INCOME
Positive sensitivity to higher interest rates, margin management and higher customer activity were reflected in the 12% rise in net interest income and the 2% increase in net fee income (+16% and +5%, respectively, in constant euros).
PROFITABILITY
Profitability improved both in the quarter and year-on-year and RoTE reached 15.1%, compared to 13.4% in 2022, supported by double-digit revenue growth.
EFFICIENCY
The acceleration of structural changes towards a simpler and more integrated model through One Transformation, which we are expanding across the Group, is driving efficiency gains and profitable growth.
The efficiency ratio was 44.1%, improving 1.7 pp compared to 2022, driven mainly by Europe where it decreased 5.2 pp.
LOAN-LOSS PROVISIONS
Loan-loss provisions amounted to EUR 3,421 million in the quarter and EUR 12,458 million (+19%) in the year, driven by the provisions in the US (normalization of the auto portfolio), DCB (portfolio growth), Mexico (the normalization of provisions and solid growth in loans to individuals) and Poland (related to CHF mortgages).
RATIOS
Credit quality remained robust, driven by strong employment in most regions. The NPL ratio was 3.14%, +6 bps higher than 2022. Total coverage ratio of impaired assets of 66%, and cost of risk stood at 1.18% (1.13% in September 2023 and 0.99% in December 2022), in line with expectations.
Quartely performance of profit attributable to the Group
EUR million
Constant euros
Well balanced Group profit. Attributable profit distribution by business area*
January - December 2023
(*) As a % of operating areas. Excluding the Corporate Centre.
Underlying income statement
% change / 2022
EUR million
2023
EUR
Constant EUR
Net interest income
43,261
12.0
15.8
Gross income
57,647
10.5
13.1
Net operating income
32,222
14.1
16.1
Profit before tax
16,698
9.5
11.3
Attributable profit to the Group
11,076
15.3
17.7
07| ACTIVITY
Customers and digitalization:
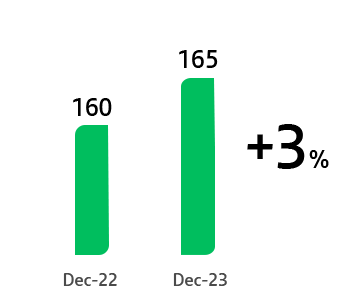
Total customers amounted to 165 million, 5 million more than in 2022.
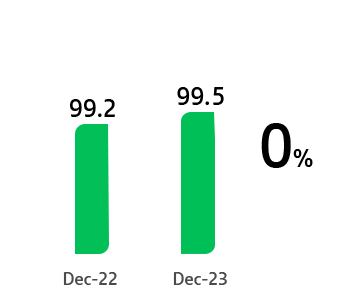
Active customers reached 100 million (99 million in 2022).
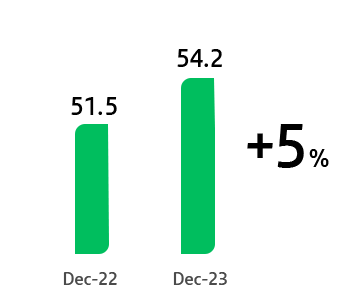
We have 54 million digital customers, a 5% increase year-on-year.
Total customers
millions
Active customers
millions
Digital customers
millions
Our balance sheet remains strong
Excluding the exchange rate impact:
Loans and advances to customers remained stable. In constant euros, they fell 1% as growth in North America, South America and DCB were offset by the reduction in Europe (lower business demand and mortgage prepayments).
Customer funds rose 4% year-on-year in euros (+4% in constant euros), having increased EUR 31.3 billion in the last quarter. Deposits rose both in individuals and corporates.
Loans to customers
Customer funds
Europe
55%
62%
North America
16%
15%
South America
16%
17%
Digital Consumer Bank
13%
6%
% operating areas. December 2023.
% change/ 2022
EUR million
2023
EUR
Constant EUR
Gross loans and advances to customers*
1,014,953
(0.4)
(1.0)
Customer deposits**
968,347
2.3
2.1
Mutual funds
208,528
13.3
13.2
Customer funds
1,176,875
4.1
3.9
*Excluding reverse repos. **Excluding repos.
08| AREAS
Performance by business area
Europe
We continue to accelerate our business transformation to achieve higher growth and a more efficient operating model which should allow us to further improve profitability and increase RoTE.
Underlying attributable profit (EUR 5,482 million) rose 44% (+45% in constant euros), with strong revenue growth, mainly from net interest income, which was able to absorb higher costs, the temporary levy on revenue earned in Spain and higher provisions in Poland due to the CHF mortgage portfolio.
Changes in constant euros.
North America
We are leveraging the strength of our global businesses to accelerate our transformation in the US and Mexico while refining our tailored service and product suite for a better customer experience.
Underlying attributable profit in 2023 reached EUR 2,354 million, down 18% year-on-year (-20% in constant euros) mainly due to LLP normalization in the US, which more than offset the good performance in Mexico.
Changes in constant euros.
South America
We are focused on increasing the value we bring to the Group and moving forward to become the most profitable bank in each of our countries across the region while promoting synergies in our global and regional businesses.
Attributable profit in 2023 decreased 17% year-on-year (-11% in constant euros) to EUR 3,038 million due to the increase in costs and LLPs.
Changes in constant euros.
Digital Consumer Bank
Continue reinforcing our auto leadership through strategic alliances, leasing (+15% active contracts year-to-date) and subscription. In non-auto, we continue to upscale our buy now, pay later (BNPL) business.
Underlying attributable profit amounted to EUR 1,199 million, an 8% fall year-on-year (-7% in constant euros) due to the impact of higher interest rates on NII, cost of risk normalization, temporary bank levy on revenue earned in Spain and CHF provisions in Poland.
Changes in constant euros.
CONCLUSION
In summary, a great set of results delivering on all our 2023 targets
2023 targets
Our 2023 achievement
Revenue1
Double-digit growth
+13%
Efficiency ratio
44-45%
44.1%
CoR
<1.2%
1.18%
FL CET1
>12%
12.3%
RoTE
>15%
15.1%
1. YoY change in constant euros.
ENES
Non-IFRS and alternative performance measures
This document contains financial information prepared according to International Financial Reporting Standards (IFRS) and taken from our consolidated financial statements, as well as alternative performance measures (APMs) as defined in the Guidelines on Alternative Performance Measures issued by the European Securities and Markets Authority (ESMA) on 5 October 2015, and other non-IFRS measures. The APMs and non-IFRS measures were calculated with information from Grupo Santander; however, they are neither defined or detailed in the applicable financial reporting framework nor audited or reviewed by our auditors. We use these APMs and non-IFRS measures when planning, monitoring and evaluating our performance. We consider them to be useful metrics for our management and investors to compare operating performance between periods. APMs we use are presented unless otherwise specified on a constant FX basis, which is computed by adjusting comparative period reported data for the effects of foreign currency translation differences, which distort period-on-period comparisons. Nonetheless, the APMs and non-IFRS measures are supplemental information; their purpose is not to substitute IFRS measures. Furthermore, companies in our industry and others may calculate or use APMs and non-IFRS measures differently, thus making them less useful for comparison purposes. APMs using ESG labels have not been calculated in accordance with the Taxonomy Regulation or with the indicators for principal adverse impact in SFDR. For further details on APMs and Non-IFRS Measures, including their definition or a reconciliation between any applicable management indicators and the financial data presented in the consolidated financial statements prepared under IFRS, please see the 2022 Annual Report on Form 20-F filed with the U.S. Securities and Exchange Commission (the SEC) on 1 March 2023 (https://www.santander.com/content/dam/santander-com/en/documentos/informacion-sobre-resultados-semestrales-y-anuales-suministrada-a-la-sec/2023/sec-2022-annual-20-f-2022-en.pdf), as well as the section “Alternative performance measures” of the Banco Santander, S.A. (Santander) Q4 2023 Financial Report, published on 31 January 2024 (https://www.santander.com/en/shareholders-and-investors/financial-and-economic-information#quarterly-results). Underlying measures, which are included in this document, are non-IFRS measures.
The businesses included in each of our geographic segments and the accounting principles under which their results are presented here may differ from the businesses included and local applicable accounting principles of our public subsidiaries in such geographies. Accordingly, the results of operations and trends shown for our geographic segments may differ materially from those of such subsidiaries.
Non-financial information
This document contains, in addition to financial information, non-financial information (NFI), including environmental, social and governance-related metrics, statements, goals, commitments and opinions.
NFI is included to comply with Spanish Act 11/2018 on non-financial information and diversity and to provide a broader view of our impact. NFI is not audited nor reviewed by an external auditor. NFI is prepared following various external and internal frameworks, reporting guidelines and measurement, collection and verification methods and practices, which are materially different from those applicable to financial information and are in many cases emerging and evolving. NFI is based on various materiality thresholds, estimates, assumptions, judgments and underlying data derived internally and from third parties. NFI is thus subject to significant measurement uncertainties, may not be comparable to NFI of other companies or over time or across periods and its inclusion is not meant to imply that the information is fit for any particular purpose or that it is material to us under mandatory reporting standards. NFI is for informational purposes only and without any liability being accepted in connection with it except where such liability cannot be limited under overriding provisions of applicable law.
Forward-looking statements
Santander hereby warns that this document contains “forward-looking statements” as per the meaning of the U.S. Private Securities Litigation Reform Act of 1995. Such statements can be understood through words and expressions like “expect”, “project”, “anticipate”, “should”, “intend”, “probability”, “risk”, “VaR”, “RoRAC”, “RoRWA”, “TNAV”, “target”, “goal”, “objective”, “estimate”, “future”, “commitment”, “commit”, “focus”, “pledge” and similar expressions. They include (but are not limited to) statements on future business development, shareholder remuneration policy and NFI.
While these forward-looking statements represent our judgement and future expectations concerning our business developments and results may differ materially from those anticipated, expected, projected or assumed in forward-looking statements.
In particular, forward looking statements are based on current expectations and future estimates about Santander’s and third-parties’ operations and businesses and address matters that are uncertain to varying degrees and may change, including, but not limited to (a) expectations, targets, objectives, strategies and goals relating to environmental, social, safety and governance performance, including expectations regarding future execution of Santander’s and third-parties’ (including governments and other public actors) energy and climate strategies, and the underlying assumptions and estimated impacts on Santander’s and third-parties’ businesses related thereto; (b) Santander’s and third-parties’ approach, plans and expectations in relation to carbon use and targeted reductions of emissions, which may be affected by conflicting interests such as energy security; (c) changes in operations or investments under existing or future environmental laws and regulations; (d) changes in rules and regulations, regulatory requirements and internal policies, including those related to climate-related initiatives; (e) our own decisions and actions including those affecting or changing our practices, operations, priorities, strategies, policies or procedures; and (f) the uncertainty over the scope of actions that may be required by us, governments and others to achieve goals relating to climate, environmental and social matters, as well as the evolving nature of underlying science and industry and governmental standards and regulations.
In addition, the important factors described in this document and other risk factors, uncertainties or contingencies detailed in our most recent Form 20-F and subsequent 6-Ks filed with, or furnished to, the SEC, as well as other unknown or unpredictable factors, could affect our future development and results and could lead to outcomes materially different from what our forward-looking statements anticipate, expect, project or assume.
Forward-looking statements are therefore aspirational, should be regarded as indicative, preliminary and for illustrative purposes only, speak only as of the date of this document, are informed by the knowledge, information and views available on such date and are subject to change without notice. Santander is not required to update or revise any forward-looking statements, regardless of new information, future events or otherwise, except as required by applicable law. Santander does not accept any liability in connection with forward-looking statements except where such liability cannot be limited under overriding provisions of applicable law.
Not a securities offer
This document and the information it contains does not constitute an offer to sell nor the solicitation of an offer to buy any securities.
Past performance does not indicate future outcomes
Statements about historical performance or growth rates must not be construed as suggesting that future performance, share price or results (including earnings per share) will necessarily be the same or higher than in a previous period. Nothing in this document should be taken as a profit and loss forecast.
Third Party Information
In this document, Santander relies on and refers to certain information and statistics obtained from publicly-available information and third-party sources, which it believes to be reliable. Neither Santander nor its directors, officers and employees have independently verified the accuracy or completeness of any such publicly-available and third-party information, make any representation or warranty as to the quality, fitness for a particular purpose, non-infringement, accuracy or completeness of such information or undertake any obligation to update such information after the date of this document. In no event shall Santander be liable for any use by any party of, for any decision made or action taken by any party in reliance upon, or for inaccuracies or errors in, or omission from, such publicly-available and third-party information contained herein. Any sources of publicly-available information and third-party information referred or contained herein retain all rights with respect to such information and use of such information herein shall not be deemed to grant a license to any third party.
Cookie settings
Are those which are necessary for the proper functioning of the website or to provide a service requested by the user. In this regard, personalization cookies that allow users to remember information with certain characteristics that may differentiate their experience from other users, such as the language or the number of results to be shown in a search, are considered necessary and, therefore, not subject to informed consent.
This type of cookies allow us to recognize and account for the number of visitors to our website, and to analyze how the browse and use it. Enabling browsing profiles to be carried out. They do not collect personal information. These include Google Analytics, a web analysis service provided by Google, Inc. For more information on how Google collects and processes you may go to https://policies.google.com/privacy?hl=en
You can consult our cookies policy at any time here or on the web.
Customer centric
Aim:
We aim to increase the number of total customers by 40 million to 200 million and of active customers by 26 million to around 125 million. This growth should contribute towards a 7-8% revenue increase per year on average between 2023-2025 in constant euros.
How:
By optimizing the product portfolio to have a simpler and more attractive offer. And, by taking advantage of the local and global scale to continue building a digital bank with branches, making 100% of the products and services available to customers on the websites and applications, leaving the branch network as a powerful complement to the digital customer service and sales channel.
Simplification & automation
Aim:
Accelerate simplification and automation of products and processes, improving user experience and overall service, rolling out new technology and fully automating operations. Our goal as a Group is to be among the most efficient banks compared to our peers, with an efficiency ratio of 42% by 2025.
How:
By optimizing products and processes while increasing automation to avoid human error and improve customer experience. This will be done by making better use of available data through artificial intelligence development. And, by intensifying efforts to reduce unit costs and capture the value of economies of scale through the use of global technology and proprietary software.
Network contribution
Aim:
Increase global businesses' contribution, generating higher revenue at lower cost, reflected in higher profitability:
SCIB: achieve an annual revenue growth of over 5% in Europe, 10% in South America and 15% in North America, between 2022 and 2025.
WM&I: annual revenue growth around or above 10% in Private Banking, SAM and Insurance in the next 3 years, in addition to being the preferred retail network fund partner.
Payments: 15% annual growth in the number of transactions between 2022 and 2025 in PagoNxt. In Cards, reach 115 million cards and achieve 25% cost savings by 2025.
Auto: increase market share in loans and strengthen the leasing business.
How:
SCIB: by reinforcing global presence and being a product 'factory' for the Group.
WM&I: by building global platforms and increasing presence in different markets.
Payments: by integrating the payment business in all units and expanding the Cards platform worldwide (already implemented in Brazil).
Auto: by expanding collaboration agreements with OEMs to all markets.
Customer activity
Aim:
The Group has one of the largest branch networks in the international banking sector (more than 9,000 branches). At the same time, it continues to invest in digital banking capabilities, evolving traditional branches with innovative and highly successful banking solutions. The goal is to improve the service provided and increase number of transactions.
How:
By increasing customer base penetration through simplification strategies and product innovation which translates into greater activity per customer. On the corporate side, the focus is to provide multiregional coverage to increase collaboration between units.
Capital
Aim:
Maintain a fully-loaded CET1 capital ratio above 12%, absorbing the impact of the Basel III final implementation, focusing on efficient capital allocation and asset rotation.
Increase RWAs offering returns above the cost of capital from 80% at the end of 2022 to 85% in 2025.
How:
By maintaining strict pricing on new business, seeking that everything we add to our balance sheet has adequate levels (2.6% RoRWA).
Increasing RWA mobilization, as we have done in recent years, with the target of reaching 12% of our RWAs in 2025.


 Constant euros