Banco Santander reaffirms its key shareholder targets for 2018
Bank confirms plans to increase Earnings Per Share (EPS) in 2016 and 2017, reaching double digits by 2018, and grow Dividend Per Share (DPS) and Tangible Net Asset Value (TNAV) Per Share every year.
London, September 30th, 2016.
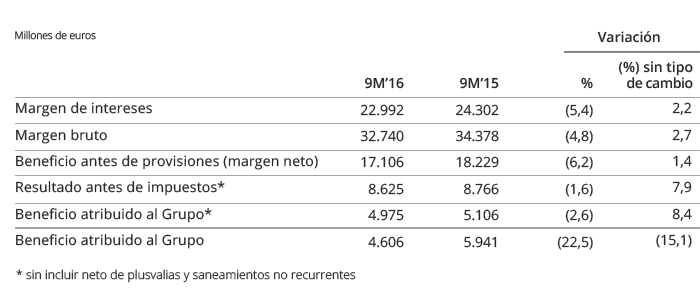
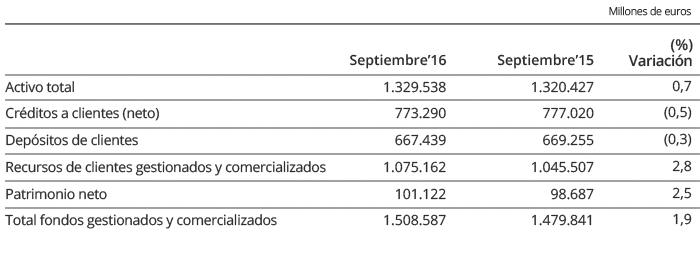
Banco Santander confirmed today that it is on track to deliver the financial targets it set in last year’s Strategic Plan 2016-2018, despite an increasingly challenging macroeconomic environment.
Speaking in London with analysts and investors at the Banco Santander Group Strategy Update 2016, Ana Botin, Group Executive Chairman, said: “We have a clear and consistent strategy that is helping us earn the loyalty of customers across our 10 core markets. Our business model is continuing to generate predictable and sustainable returns and we are delivering on our financial and commercial commitments, despite the challenging environment.”
Over the last year, macroeconomic expectations have deteriorated in some of the markets in which the Group operates, particularly in the U.K. This has led to a depreciation of many currencies against the Euro and an expectation that interest rates will remain at record low levels for longer than expected. Moreover, regulatory uncertainty will continue in the coming years and tax pressure is also increasing in some of Banco Santander’s core countries.
Despite this context, Santander confirmed today that it is maintaining the key 2018 targets within its 2016-2018 Strategic Plan, including the commitment to increase dividend per share (DPS) and earnings per share (EPS) every year in the next three years. Santander also confirmed today that it will deliver against its target to increase the number of loyal customers to 18.5 million by 2018.
Furthermore, the Bank aims is to increase the number of digitally active customers from 15 million in 2015 to 30 million in 2018. In the last twelve months the number of loyal customers increased by 10% to 14.4 million, while digitally active customers increased by 23% to 19.1 million. Moreover, the average market share in SMEs and Corporates across the Bank increased by almost a half percentage point.
José Antonio Álvarez, Group Chief Executive Officer, said: “While the environment in some of our markets has deteriorated, our strategy and business model continues to deliver for our customers and shareholders. Our geographic diversification with strong market presence and best-in-class efficiency offers a clear competitive advantage that will allow us to benefit further as the economic environment improves.”


 Currency-neutral basis


 189,675 professionals
 124 million customers
 3.9 million shareholders
 1.2 million people helped in 2015