
"Underlying profit is above 4.2 billion euros, which is more than double than in the first half of 2020.”
Welcome to the new Quarterly Shareholder Report where you can check the most significant information about Santander's share and the Group in the second quarter of 2021.
Browse from the home page to access each of the sections or move the cursor downwards to view the complete report.


 Constant euros
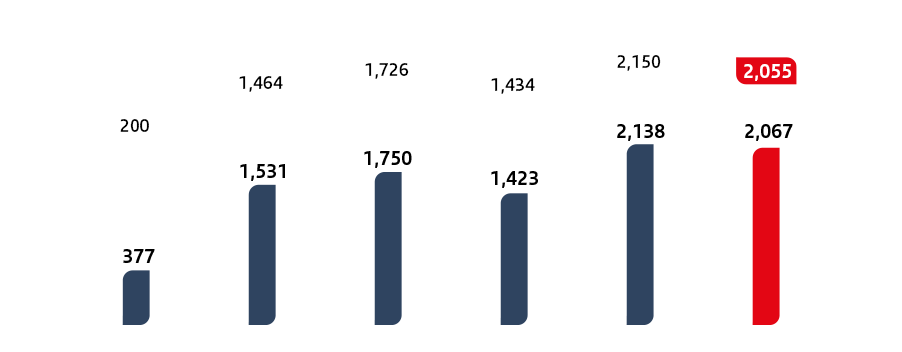

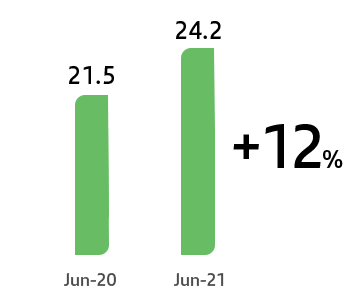
Santander finance for all: providing access, microfinance and financial education
Financially
empowering
people
1.1 mn in H1’21;
6.0 mn since 2019
2025 goal: 10 mn
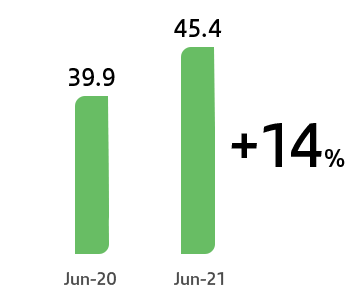
Microcredit
EUR 261 mn H1’21;
EUR 1.2 bn since 2019